Efficient Frontier
William J. Bernstein
Efficient Frontier
William J. Bernstein
![]()
Case Studies in Rebalancing
I'm often asked about the optimal portfolio rebalancing frequency. In previous pieces I showed that the benefit from rebalancing is contingent upon 3 factors:
- The volatility of the portfolio assets. The more volatile, the better.
- The correlations of the portfolio assets. Lower correlations mean higher rebalancing returns.
- The differences in returns among the assets. The lower, the better. If asset returns are very different, then you in fact may be better off not rebalancing.
I've intentionally left out the tax and transactional costs of rebalancing. It's assumed that the portfolio is sheltered. (With taxable accounts, beyond the use of net investment/withdrawal and the reallocation of mandatory distributions, active rebalancing is generally not a good idea. In order to get a closer look at the problem I've taken a fairly conventional portfolio:
- 40% S&P 500
- 15% US Small Stocks
- 15% Foreign Stocks
- 30% 5-Year Government Bonds
All four of these assets are available in the DFA returns program, and it is a relatively easy matter to crank out the returns for portfolios rebalanced monthly, quarterly, annually, biannually, and every 4 years. In order to smooth things out I used 24 28-year periods, staggered by one month:
From
To
Monthly
Quarterly
Annual
2 Years
4 Years
Jan-69
Dec-96
11.01%
11.10%
11.11%
11.52%
11.37%
Feb-69
Jan-97
11.09%
11.10%
11.10%
11.40%
11.46%
Mar-69
Feb-97
11.27%
11.34%
11.27%
11.54%
11.69%
Apr-69
Mar-97
11.06%
11.15%
11.03%
11.23%
11.40%
May-69
Apr-97
11.10%
11.12%
11.14%
11.28%
11.48%
Jun-69
May-97
11.31%
11.37%
11.41%
11.49%
11.68%
Jul-69
Jun-97
11.66%
11.76%
11.76%
11.81%
12.01%
Aug-69
Jul-97
12.04%
12.05%
12.15%
12.14%
12.35%
Sep-69
Aug-97
11.81%
11.87%
11.91%
11.90%
12.04%
Oct-69
Sep-97
12.09%
12.19%
12.24%
12.15%
12.23%
Nov-69
Oct-97
11.81%
11.87%
11.82%
11.81%
11.94%
Dec-69
Nov-97
11.94%
12.01%
12.06%
11.98%
12.12%
Jan-70
Dec-97
12.07%
12.17%
12.16%
12.09%
12.26%
Feb-70
Jan-98
12.27%
12.28%
12.26%
12.23%
12.38%
Mar-70
Feb-98
12.31%
12.38%
12.31%
12.29%
12.39%
Apr-70
Mar-98
12.44%
12.54%
12.42%
12.38%
12.47%
May-70
Apr-98
12.82%
12.83%
12.84%
12.77%
12.85%
Jun-70
May-98
12.93%
12.99%
12.97%
12.95%
13.02%
Jul-70
Jun-98
13.10%
13.19%
13.14%
13.13%
13.21%
Aug-70
Jul-98
12.86%
12.88%
12.95%
12.96%
13.00%
Sep-70
Aug-98
12.30%
12.37%
12.38%
12.43%
12.48%
Oct-70
Sep-98
12.28%
12.36%
12.44%
12.58%
12.65%
Nov-70
Oct-98
12.54%
12.55%
12.62%
12.88%
12.92%
Dec-70
Nov-98
12.61%
12.68%
12.70%
13.04%
13.00%
Average
12.030%
12.090%
12.091%
12.166%
12.267%
This is a fairly tedious table, but cursory examination shows that for almost all periods studied there is a monotonous improvement as one increases rebalancing period, except that there seems to be little difference between annual and quarterly rebalancing. (And for those of you who are hard core stat nuts, except for annual/quarterly pairwise t tests between all of the periods are highly significant.) The reason for this is fairly obvious. Asset class returns are not a perfect random walk. If they were, then there would be no profit to rebalancing. After all, rebalancing amounts to a bet that last year's above/below average return will reverse next year. If this is not the case, then there is no sense in rebalancing. There is overwhelming evidence that there is short-term persistence in asset class returns, so it is a good idea not to be too hasty pulling the trigger. To illustrate this point I've plotted the ratios between the 4 year end-wealth of the 3 equity assets studied.
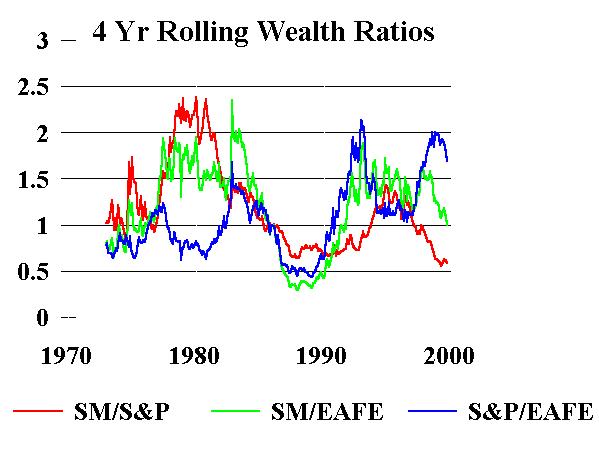
Notice how a 4 year end-wealth ratio of 2.0 (or 0.5, which has the same meaning) is not at all unusual. In other words, start out with a buck of each asset and four years later it is entirely possible that one will be worth twice the other. If you rebalance the pair frequently along the way, you're liable to get the short end of the stick.
So, at first blush the answer to the rebalancing frequency problem would seem to be "not very often." But appearances are deceiving. Take a look at the bottom row of the above table. The average difference between quarterly and 4-yearly rebalancing is only 18 basis points. This comes at a cost—namely, that over a 4-year period your allocation will get seriously out of wack, incurring higher risk. For example, the above 40/15/15/30 S&P/SM/EAFE/bond portfolio, started at policy in January 1995 would have wound up at 56/13/10/21 if not rebalanced over the next 4 years.
The alternative to calendar rebalancing is threshold rebalancing. In other words, instead of regularly rebalancing, instead waiting until an asset's portfolio contribution gets x percent out of wack before adjusting it back to policy. Unfortunately, I know of no good way of evaluating this method, since tiny changes in the threshold are critical. In other words, whether your threshold for large or small stocks was barely reached, or barely missed, on October 19, 1987 makes a whopping difference. And in any case, it ain't gonna happen the same way next time.
So, what can we conclude from all this?
- Monthly rebalancing is too frequent.
- There are small rewards to increasing one's rebalancing frequency from quarterly up to several years, but this comes at the price of increased portfolio risk.
You makes your choice and you takes your chances, but don't sweat this one too much. The returns differences among various rebalancing strategies are quite small in the long run.
![]()
![]()
![]()
![]()
Copyright © 2000, William J. Bernstein. All rights reserved.