- 20% S&P 500
- 20% US small stocks (DFA US 9-10 Portfolio)
- 15% EAFE-Europe
- 5%EAFE Pac. Ex Japan
- 5% Japan Large (MSCI Japan)
- 10% Continental Small (DFA Cont. Sm. Co. Portfolio)
- 5%UK small (DFA UK Sm. Co. Portfolio
- 5% Japan Small (DFA Jap. Sm. Co. Portfolio)
- 5% Pac. EX Japan small (DFA Pac. Rim Sm. Co. Port., before 1/93 EAFE Pac. X J)
- 10% Latin American (MSCI Lat. Am.)
- 20% Vanguard Index Trust 500
- 20% Vanguard Small Cap Index Fund
- 15% Vanguard European Index Portfolio
- 7% Vanguard Pacific Index Portfolio
- 8% Vanguard Emerging Markets Index Portfolio
- 5% Scudder Latin America Fund
- 12.5% Tweedy Browne Global Value Fund
- 12.5% Acorn International Fund
- 25% DFA US Large Cap Value
- 25% DFA US Small Cap Value
- 25% DFA Int'l Value
- 25% DFA Int'l Small Cap Value
The Intelligent Asset Allocator

William J. Bernstein
![]()
The Ducks are Quacking. Feed them.
--IPO underwriter battle cry
Perhaps investors are more sophisticated then they were a generation or two ago. Sadly, though, they still chase performance as avidly as my dog chases birds on the beach.July 14's Wall Street Journal brought word that investors have once again got Saturday Night Fever with a Latin beat. Record amounts flowed into south-of the-border funds, inspired by near 50% returns in the first half of this year. One analyst from GT Global offered "The election results were a big plus for Mexico." Where was this genius two years ago when prices on the Bolsa were half of today's? In fairness, most of the analysts consulted for the piece suggested that the new investors rushing into these funds were fat, dumb, happy, and very liable to get egg on their faces in the not too distant future. Morningstar's maven flatly opined "They chase performance."
Well, yes. But that is not where the ottoman really meets the fan. Where our friend from GT Global, as well as the new money, errs is in attempting to extrapolate the news into investment returns. There may be a correlation between economic or political data and returns, but it is weak and most likely negative. Even the most cursory examination of market history shows that economic optimism is often a precursor of poor returns (1929, 1966) and that economic disaster (1932, 1974, 1982) is usually a recipe for high returns. In the global marketplace, Cambell Harvey has recently shown that nations with high perceived political and economic instability have higher returns than more stable nations. This should not surprise -- the fundamental investment equation is the positive correlation of risk and return.
Which brings us to the July 1997 Coward's survey. The 3 cowards do not attempt one iota of active allocation. As in previous issues, we compare the risk/return characteristics of our automatons with the performance of the "multiasset global" and "asset allocation" funds in the Morningstar universe. To review, the 3 portfolios we have studied in the past are fixed mixes of the following indexes/funds, rebalanced quarterly:
The Coward's Portfolio (CEI)
(This portfolio is mixed with the DFA 1 year corporate bond fund to produce a risk/return curve for the past 3 and 5 years.)
The Small Investor's Coward's Portfolio (SICEI)
(This portfolio is mixed with the Vanguard Short Term Corporate Bond Fund to produce a risk/return curve for the past 3 years. )
The Academic Coward's Portfolio (ACEI)
(This portfolio is mixed with the DFA 1 year corporate bond fund to produce a risk/return curve for the past 3 years. )
The Problem with Indexing? -- A 4th Coward
A Simple, but Active, Approach
Readers of Efficient Frontier know that I am no fan of active management. And yet, I am troubled by one aspect of indexing -- the fact that indexes usually hold stocks in cap weighted proportions. This tends to overweight overpriced stocks, and should at least in theory lower returns accordingly. This goes double for global portfolios. Not only will overpriced stocks be overweighted, but so too will overvalued national markets. The extraordinary returns of large growth stocks in the past 10 years means one of two things: either all of the academic data demonstrating the superiority of value ("cheap") stocks is wrong, or else the past 10 years have been an extraordinary anomaly. The latter seems more reasonable.Accordingly, one might look for a fund which picks stocks according to strict Graham and Dodd criteria without regard to nationality or market cap, and has low turnover and expenses. The Tweedy Browne Global Value Fund meets most of these criteria. It is not perfect -- its expenses are a trifle high at 1.6%, and it does not invest in emerging markets. (Its annual reports usually contain the admonition "We don't invest anywhere we can't drink the water.") This fund has only about 15% domestic exposure, reflecting high stock valuations in the US. It is also completely currency hedged, and I will leave the pros and cons of that particular can of worms for another day. I've chosen to combine this fund with the Vanguard Short Term Corporate Bond Fund, to produce a return/risk spectrum accessible to the small investor.
Remember, the CEI and ACEI are meant as a benchmarks for institutional investors. The SICEI and Tweedy portfolios are provided as portfolios easily accessible to the small investor.
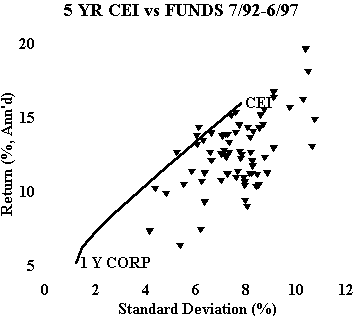
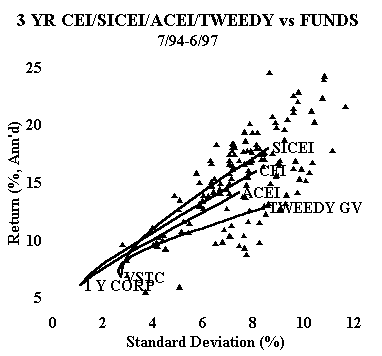
With all that out of the way, here are the results for 5 years (CEI only) and 3 years (all 4 indexes):
Over 5 years, no fund beats the CEI by a significant amount on a risk adjusted basis. Period. Only 3 funds protrude slightly above the line: the Sogen International, Merrill Lynch Global Asset A, and Berwyn Income Funds. Several funds produce returns higher returns than the all equity CEI, but all do so with higher risk than the CEI. All fall on or below the imaginary line projected up and to the right of the all equity CEI.Over a 3 year period, things are not so pretty. Only the SICEI beats most of the actively managed portfolios, but a substantial number of funds perform better on a risk adjusted basis. The other 3 cowards do not beat the majority of funds on a risk adjusted basis. The reason for this is obvious -- over the past 3 years large cap US stocks, still the mainstay of most allocation funds, have outperformed all other assets. In the 157 fund 3 year sample, the average foreign exposure is only 23.5%, and the median market cap a whopping $13.2 billion.
The Tweedy Browne approach does particularly poorly for this reason, with its 85% foreign exposure. There is another, more subtle reason, for Tweedy's poor performance -- the national allocation generated by strict adherence to value cirteria is tends to be rather lopsided, being at present 50% European, with about 15% each US and Japanese, and little exposure to the Pacific Rim or Emerging Markets. This results in a modest increase in risk. Confounding the analysis is the fact that the fund holds about 15% cash. Still, I think that the Tweedy Browne approach holds promise as an alternative model for asset allocation, and should do well as reversion to the mean closes the gap between US and foreign equity returns.
The past 3 years have been a particularly awkward time for the cowards, although the stellar performance of the CEI over the longer time period is encouraging. By this time next year, when I plan to update them again, the CEI will have a 10 year track record, and the SICEI, ACEI, and Tweedy approach a 5 year record. Stay tuned.
![]()
![]()
copyright (c) 1997, William J. Bernstein

