- Decide how much equity you can stomach, and adjust your stock/bond allocation accordingly.
- Allocate your stock assets among a wide variety of global regions in a prudent manner.
- Let George do the rest while you get on with life's more salient matters.
The Intelligent Asset Allocator

William J. Bernstein
![]()
The Brinson 93.6% Hoohah, or,
The Fable of the Blind CFAs and the Portfolio
The worlds of academic and practical finance are a wonder to behold. A decade ago Gary Brinson and 3 of his colleagues published a pair of articles in Financial Analysts Journal analyzing the variation of quarterly returns of pension fund managers. They came to the conclusion that greater than 90% of the variability of returns of a given fund could be explained on the basis of the allocation to cash, bonds, and stocks. Given the radically different behavior and long term returns of these three assets, this is not exactly front page news. It should not surprise that in the fourth quarter of 1987 an overweighting in stocks resulted in below average returns, while an overweighting in bonds mitigated the damage.
Over the next several years, financial planners of all stripes took up the battle cry -- "Your investment returns are almost entirely the result of asset allocation." Forget stock picking, forget security selection, give us your money to manage and we'll find you a profitable allocation. The FA business boomed.
The backlash was inevitable, although remarkably tardy. This spring William Jahnke published an article in the Journal of Financial Planning with the incendiary title "The Asset Allocation Hoax." He reanalyzed the Brinson data and came to the conclusion that in fact asset allocation was of minor importance. More specifically, the range of expected returns based on asset allocation alone fell within a 1.0% range (9.47% to 10.47%) , whereas there actually was a 7.55% range (5.85% to 13.4%) of fund performance for the study period. Compare the two numbers and you get a 14.6% contribution of asset allocation, far less than Brinson's 93.6%.
Others have come to the same conclusion. Paul Pudaite, chief statistician at Morningstar Products, came to a very similar estimate of a 16.5% contribution of asset allocation to the performance of a group of mutual funds.
So, who's right? Probably everyone. Remember the story of the blind men and the elephant? Feel only the tusk, trunk, or tail, and you will come to a very different conclusion about the nature of the beast.
By way of illustration, consider the 1970-96 database of national/regional/fixed income assets referred to before on these pages. I've listed both the returns for the full period as well as the last 7 years for each asset:
1970-96 Return 1990-96 Return S&P 500 12.27% 14.37% US Small Stocks 14.15% 15.62% EAFE-E 13.05% 11.97% EAFE-PXJ 12.26% 15.67% EAFE-Japan 14.54% -4.73% Gold Equity 13.70% 1.09%
Note how similar the returns are for the 6 equity assets for the 27 year period, and how dissimilar they are for the 7 year period. This database suggests that the allocation of global stock assets makes a much bigger difference over shorter time periods than for longer ones. Looking at asset returns for individual years the average spread of returns between the assets, measured as the SD, was 20.8%; for the whole 27 year period the spread was only 0.88%. If the data for the 27 year period was due to random walk behavior, then one would have expected a 4% spread (20.8% divided by the square root of 27) instead of the 0.88% actually observed. In other words, the stock assets exhibited a strong tendency towards mean reversion.
What does this all mean? Let's consider the returns for each stock asset for the years 1987, 1990, 1993, and 1995:
1987 1990 1993 1995 S+P 500 5.23 -3.17 9.90 37.53 US Small Stocks -9.30 -21.56 21.00 34.48 EAFE-E 4.10 -3.37 29.79 22.13 EAFE-PXJ 4.20 -10.15 80.35 12.95 EAFE-Japan 41.87 -36.18 25.05 0.69 Gold Equity 37.53 -23.73 82.87 1.91
In 1987 a badly managed fund heavy in the Nikkei would have probably outperformed the best managed fund with a high weighting in US microcaps. In 1990 the same Japanese weighting would have killed you. In 1993 the worst manager with a liking for Pacific Rim or gold stocks would have bested the smartest US equity manager, whereas the situation was reversed in 1995. And so it goes. Obviously, then, on a year to year (or even a decade to decade) basis, allocation among global assets matters a great deal, but in the long run, it's a wash.
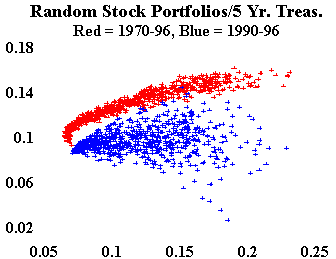
To further illustrate this point I've used the 1970-96 database to generate 800 random stock portfolios in the following manner: We started with 5 year bond allocations of 0%, 5%, 10%, etc., in 5% increments to 95%. At each 5% bond increment the remaining portfolio was filled out by 40 random allocations of the above 6 stock assets. The returns and SDs for the 27 year 1970-96 as well as the 7 year 1990-96 period were calculated. I'm indebited to colleague David Wilkinson for generating the random portfolios and returns. The results are presented below:
Note how narrow the range of returns is for the longer period at any given level of risk, versus the rather wide variation of returns for the more recent 7 year period. Conclusion number one: Over very long time periods, your allocation among different global assets matters very little. Contrariwise, over shorter periods, it is much more important. Unfortunately, if you're a fund manager and bet on the wrong global pony, you'll be out of a job long before mean reversion can save you.
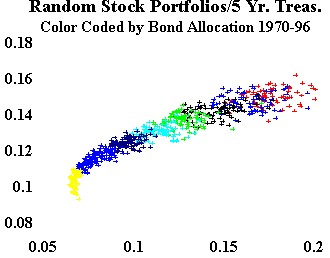
Next, I plotted the same data for the 27 year period, but this time color coded the data points by bond composition, changing color with every 10% change (2 steps) in bond composition:

Conclusion number 2: Your overall commitment to stocks versus bonds is extremely important, even over very long time periods. This is of course precisely the point Brinson et. al. were trying to make -- stocks versus bonds versus cash matters. It matters a great deal.
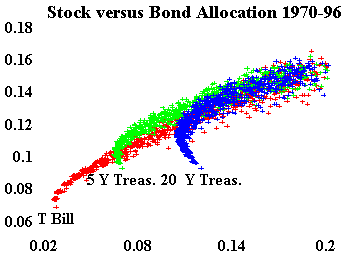
Finally, just for fun I combined the plots for the 3 different fixed income categories: 20 year, 5 year, and 30 day treasuries:

Conclusion number 3: Over the long haul long versus short bonds matters only with portfolios of low volatility.
To summarize, then, over the very long term your overall percentage exposure to equity is of primary importance. Your precise global stock allocation is not. Your choice of bond duration is important only if bonds make up the largest part of your portfolio.
Unfortunately, we are all investing in the here and now of the short term. As the above tables and graphs so clearly illustrate, over periods of less than 10 years all aspects of allocation are critical. The short term, if you will, is the unforgiving tusk of the beast -- hard, sharp, and dangerous if approached from the wrong angle. The long term is the trunk -- soft, muscular, and a not uncomfortable way to the top of the animal.
The sorts of return spreads encountered above from the stock-bond paradigm above are in the range of about 5%. The short term spread in global portfolio returns are about 5% also. Over 10 year time periods, the same sorts of differences are seen in fully invested domestic equity funds. So, let's call it a draw: asset allocation and security selection are of about equal importance. In the long run, stock/bond allocation and security selection are also about equally important, but global stock allocation probably drops out of the equation.
Let George Do It
The punch line here is that the answers don't do us much good if we're asking the wrong questions. The real question is not asset allocation versus security selection, but whether active management in any of these areas is worthwhile. In another piece in this month's EF we show that even the best managed funds do not necessarily produce an efficient portfolio, and the long term success of the Coward's Portfolio suggests that active global managers are simply not capable of besting a mechanically rebalanced arbitrary mixture of global equity indexes (the "Coward's Equity Index," or "CEI"). In fact, one might entitle the portfolio plots shown above "portfolio coward goes on a random walk."
It turns out that one of the few global mutual funds to match the efficiency of the CEI is Mr. Brinson's flagship Global Fund. The fund's allocation is interesting: 22% US equity, 17% foreign equity, 36% dollar denominated bonds, 18% non dollar bonds, and a smattering (6%) of emerging markets securities. The 3 year Sharpe ratio of the fund is 2.18 versus 2.21 for the CEI and 1.08 for the fund's multiasset/global (Morningstar) peers. I guess the moral here is watch the man's hands, not his lips.
Pilots casually refer to their autopilots as "George." George is not very bright, but he does some things very, very, well. For example, if you've ever landed in dense fog, the chances are George did it -- he can fly the runway's instrument landing system (ILS) more precisely and smoothly than any human pilot. In fact, the Category III ILS procedures used to land in the poorest weather conditions are strictly hands-off affairs for the humans watching the gauges -- no fingering allowed. In the same way, efficient global portfolio management is best done on autopilot. Try to outguess the markets and you're liable to establish ground contact considerably off the runway centerline, and maybe even completely off the airport.
So how important is "asset allocation?" Wrong question. More relevant to the investor is the question of how worthwhile professional efforts at both asset allocation and security analysis really are. The film "Less Than Zero" comes to mind.
For small investors the answer seems to be:
copyright (c) 1997, William J. Bernstein
